Setting an ELK SIEM for monitoring and incident response
Setting an ELK SIEM for monitoring and incident response
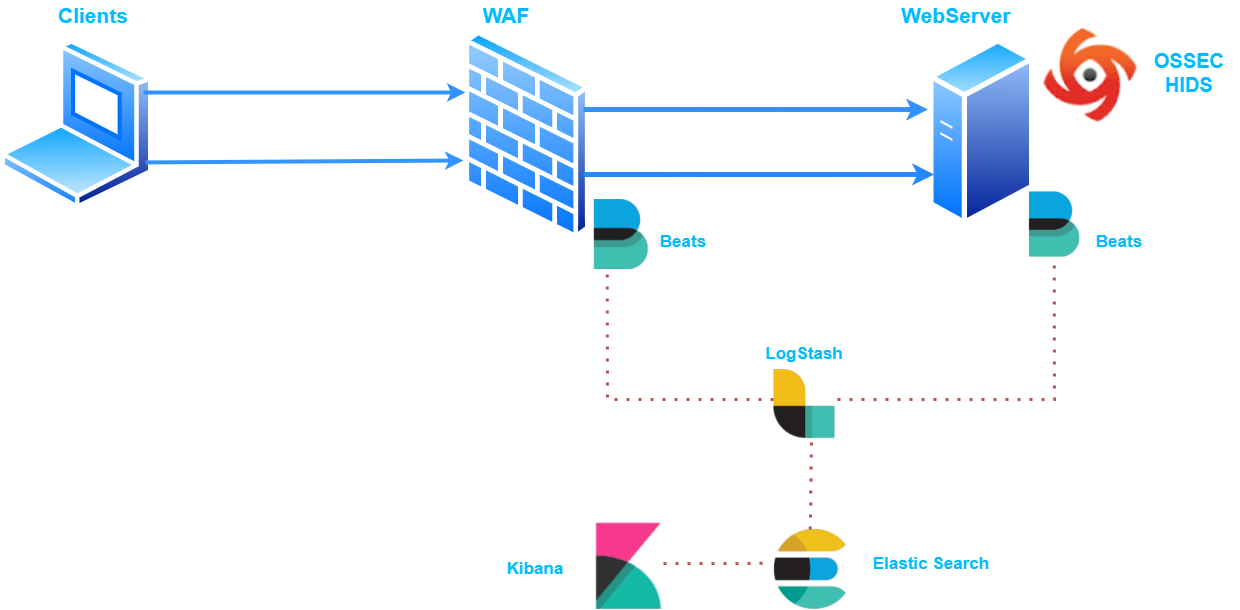
Architecture :
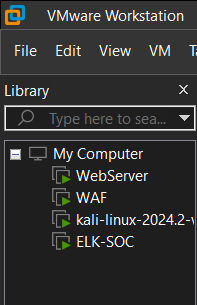
Labs :
Implementation :
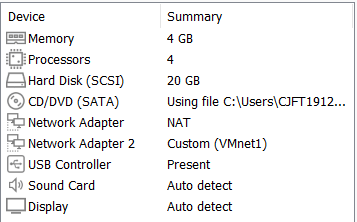
On our SOC environment ( Ubuntu Server ) :
Install Dependencies
1
sudo apt update && sudo apt upgrade
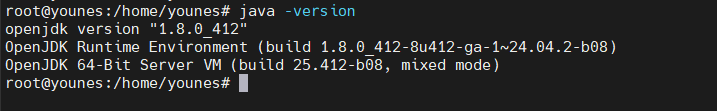
Install Java :
1
sudo apt install openjdk-8-jdk
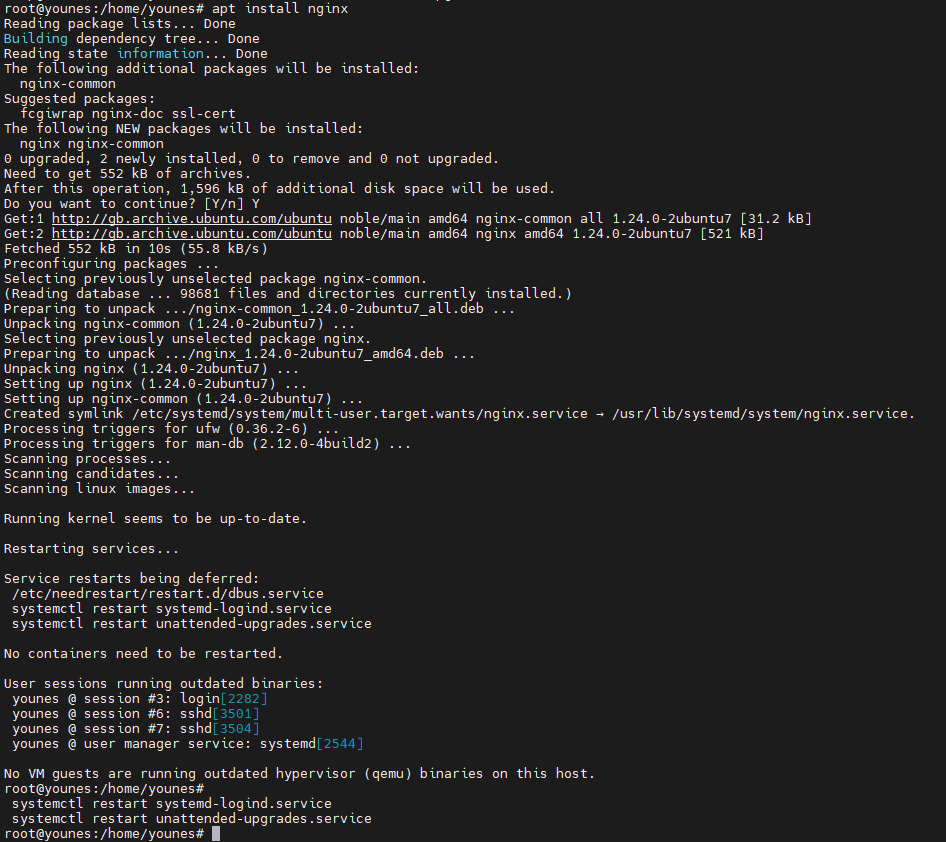
Install Nginx :
1
sudo apt install nginx
Add Elastic Repository
the elastic repositories gives you access to all the opensource software in the ELK stack.
Add GPG key to APT trusted keys :
First, for a safe and secure access to Elasticsearch resources we import the GPG key which ensures the following security reasons :
- Integrity : Ensures the downloaded packages have not been altered.
- Authenticity : Ensures that the downloaded packages are indeed from the Elasticsearch developers.
- Security : Prevents installation of potentially malicious software
apt-transport-https ensures the download of packages over the secure HTTPS Protocol.
1
wget -qO - https://artifacts.elastic.co/GPG-KEY-elasticsearch | sudo apt-key add -

Add the Elasticsearch APT repository to the system :
In order to install the Elasticsearch package allong with its dependencies using the apt package manager, we should add the Elasticsearch APT repository to the system
1
sudo sh -c 'echo "deb https://artifacts.elastic.co/packages/8.x/apt stable main" > /etc/apt/sources.list.d/elastic-8.x.list'
Install & Configure ElasticSearch
Install ElasticSearch :
1
sudo apt install elasticsearch
Start and enable ElasticSearch :
1
sudo systemctl start elasticsearch.service
1
sudo systemctl enable elasticsearch.service
Install & Configure Kibana
Install Kibana :
1
sudo apt install kibana
Configure Kibana :
1
vim /etc/kibana/kibana.yml
1
2
3
server.port: 5601
server.host: "0.0.0.0"
elasticsearch.host: ["http://MACHINE_IP:9200"]
Start and Enable Kibana :
1
sudo systemctl start kibana
1
sudo systemctl enable kibana
Configure Elastisearch :
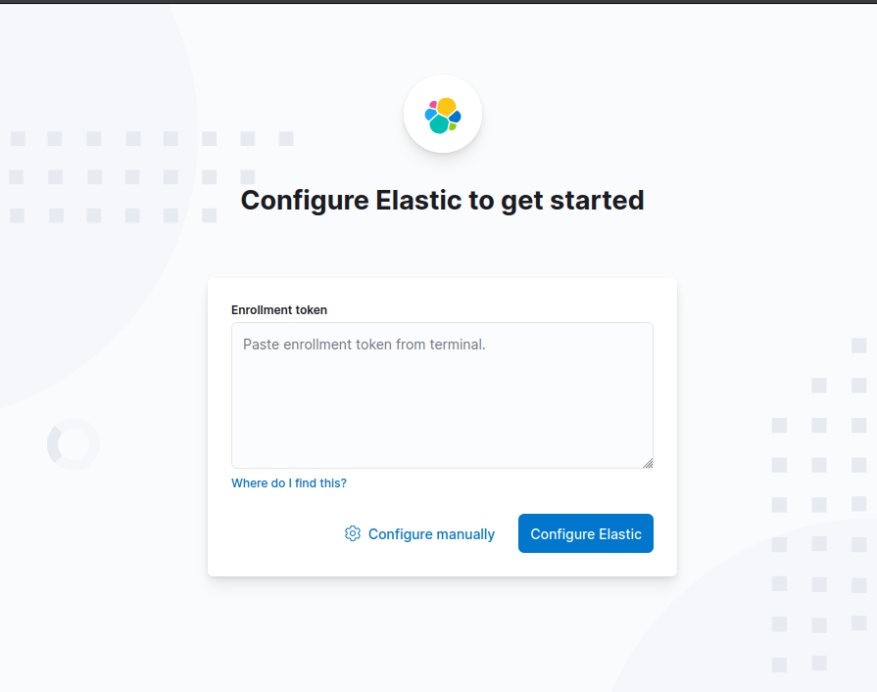
We generate a token using the command :
1
sudo /usr/share/elasticsearch/bin/elasticsearch-create-enrollment-token -s kibana
and we get a verification code using :
1
/usr/share/kibana/bin/./kibana-verification-code
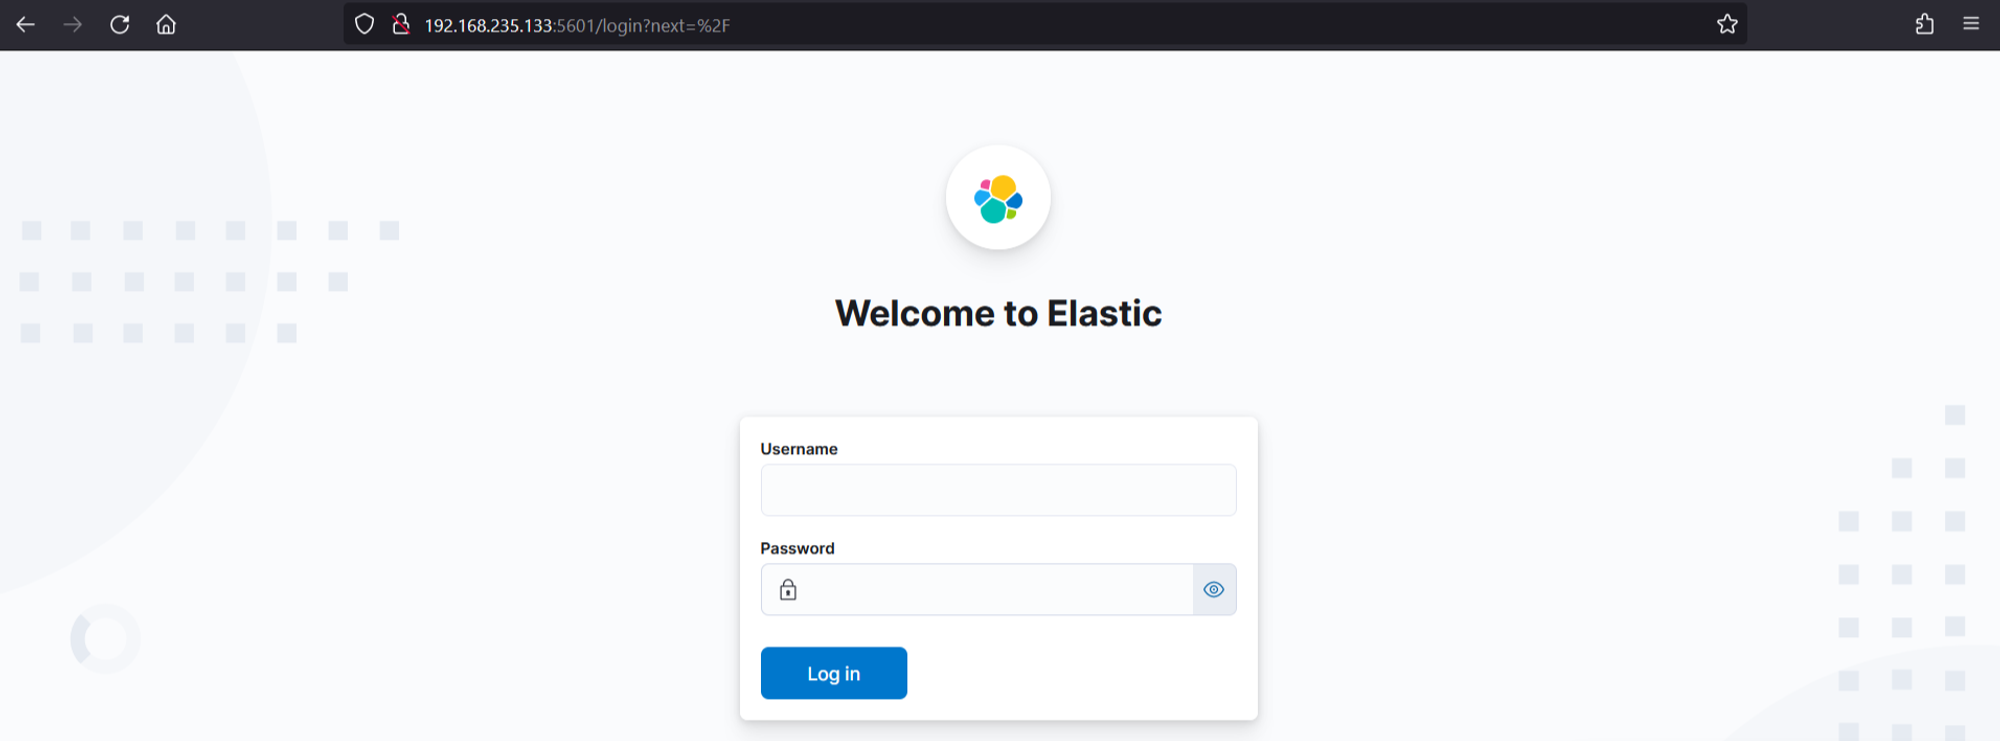
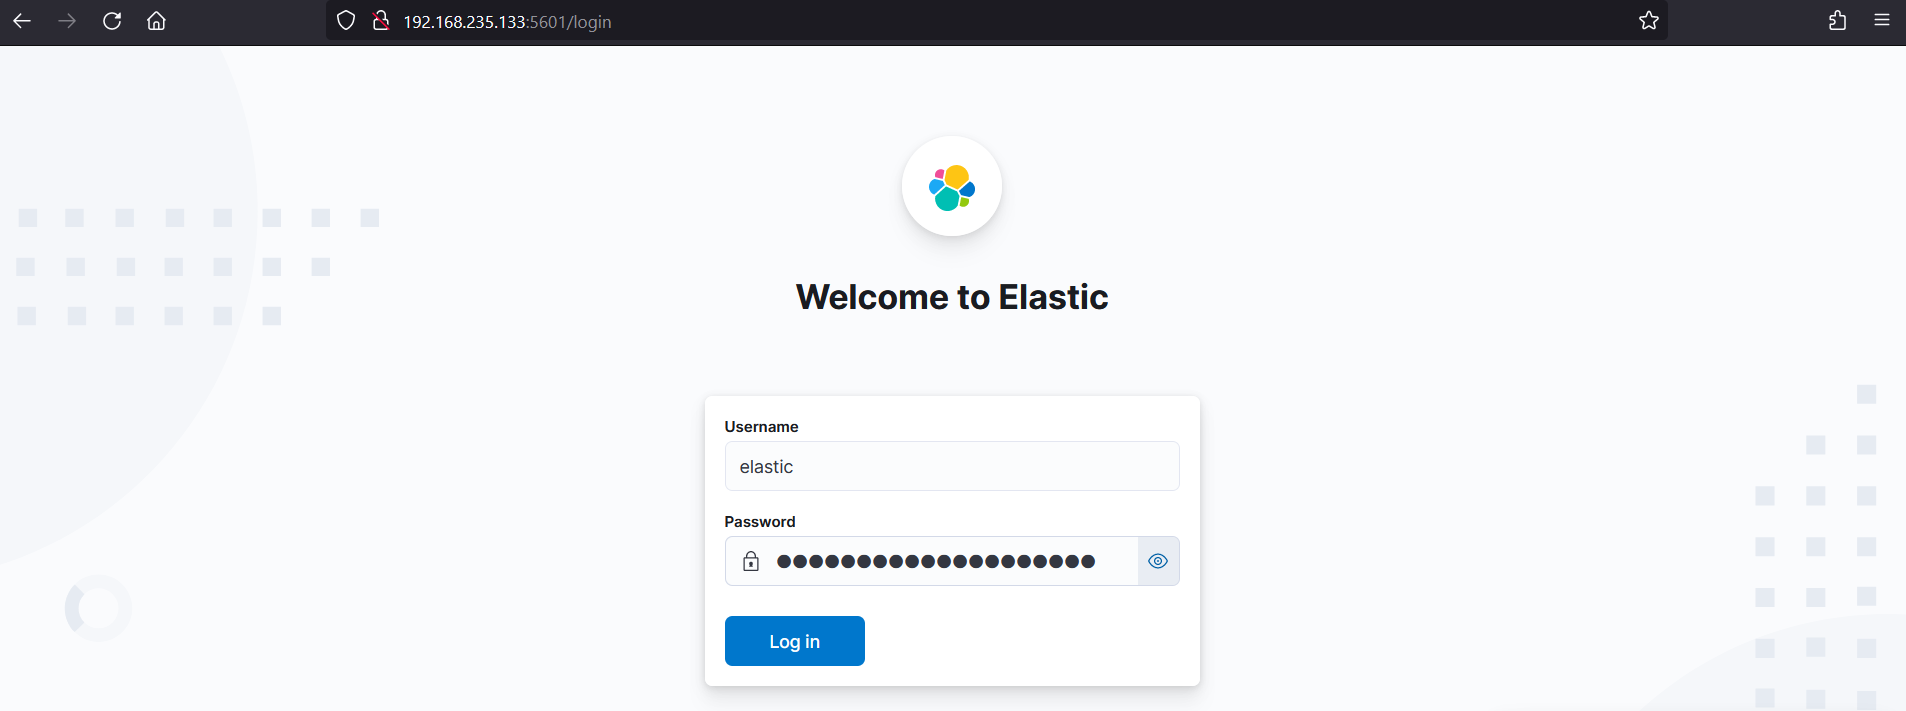
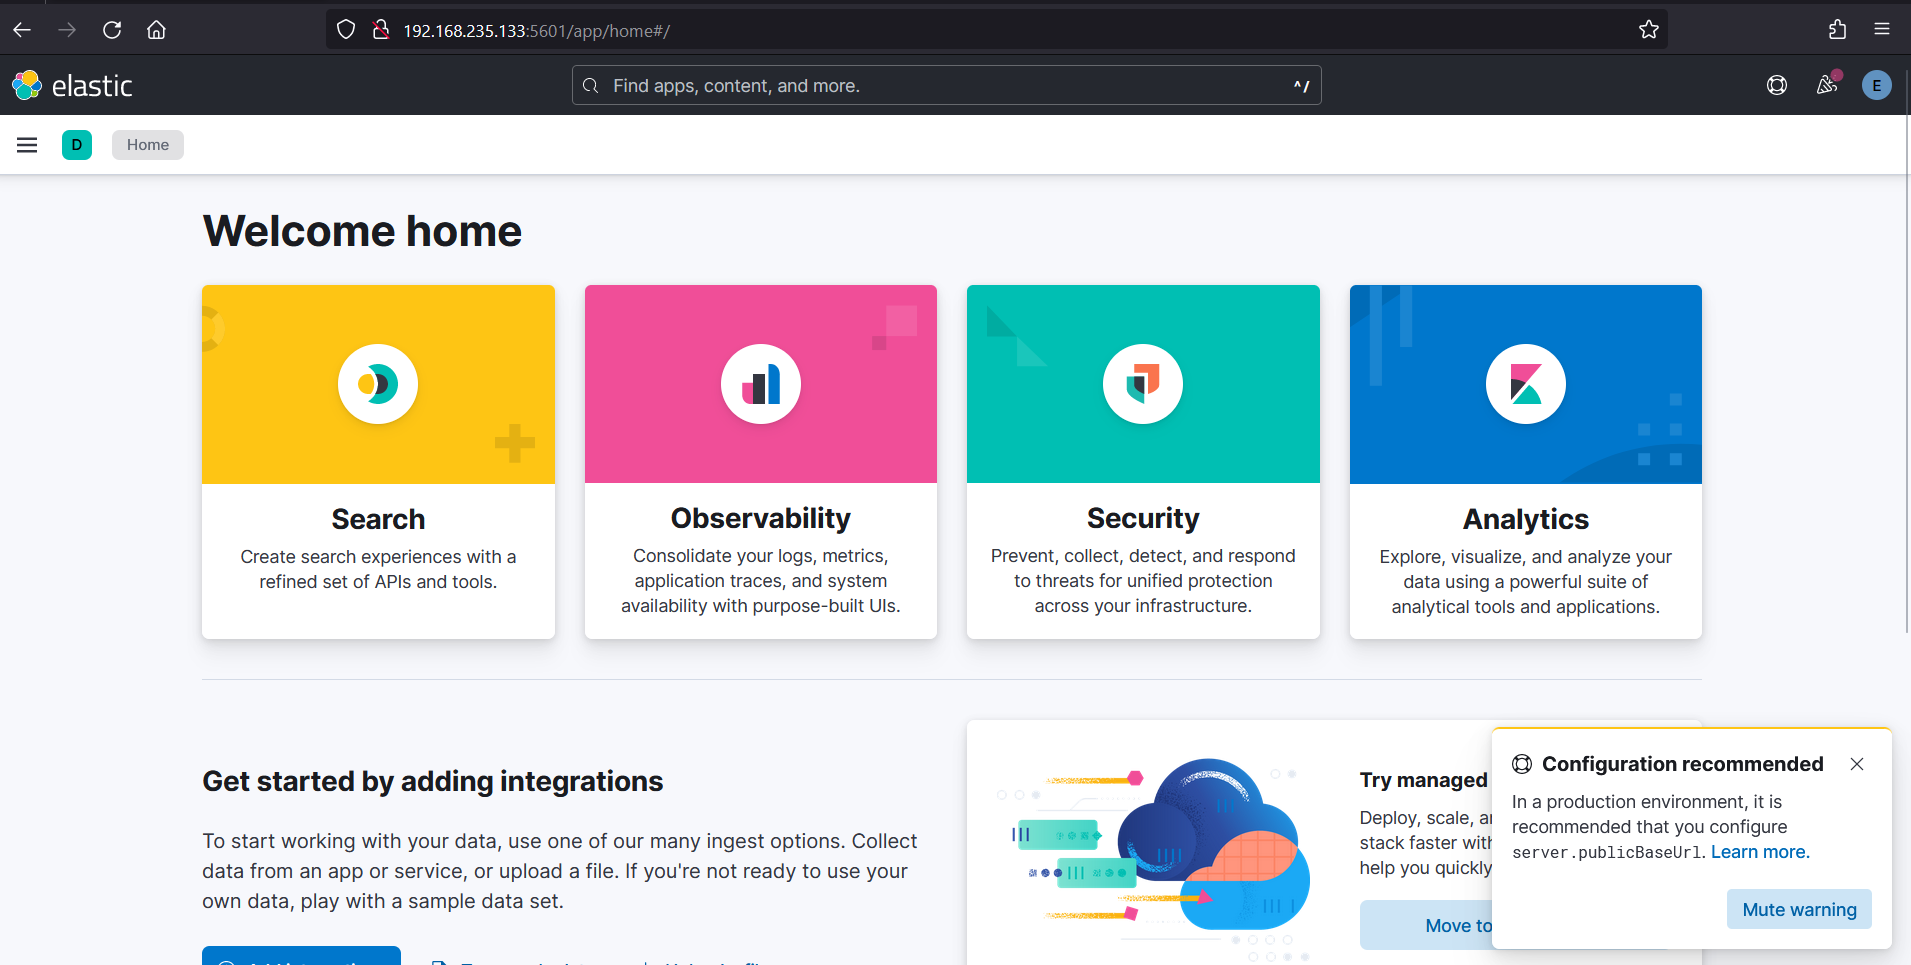
Login Page :
Reset the password for the elastic user :
1
/usr/share/elasticsearch/bin/./elasticsearch-reset-password -u elastic
Beats Agents Implementation :
Installing Filebeats the WebServer and the WAF :
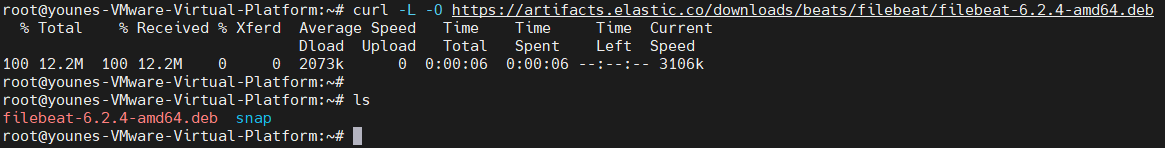
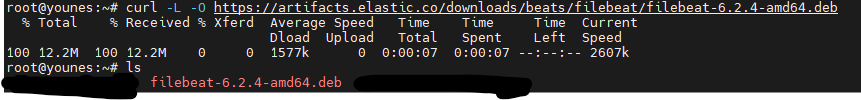
Download the filebeat using curl :
1
curl -L -O https://artifacts.elastic.co/downloads/beats/filebeat/filebeat-6.2.4-amd64.deb
WebServer:
WAF:
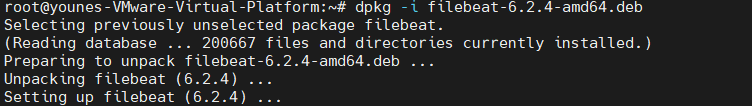
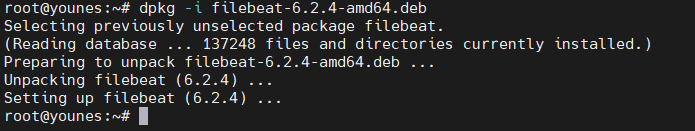
Install filebeat using dpkg :
1
sudo dpkg -i filebeat-6.2.4-amd64.deb
WebServer:
WAF:
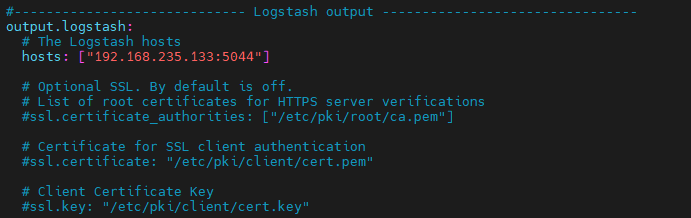
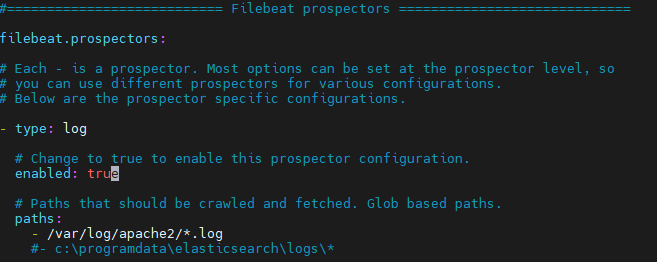
Configure the filebeat configuration file to ship the logs to logstash
1
vim /etc/filebeat/filebeat.yml
WebServer:
the webserver is on a docker container therefore we need the logs related to the docker container :

The log files for our docker container are in here :

this is the container log file :
85a498b72d5c75b54fc136e5b22eb6203b862f4c567b6b2163e732e5ff8469fa-json.log
The log files for our OSSEC HIDS are in here :

on the /etc/filebeat/filebeat.yml we add the line
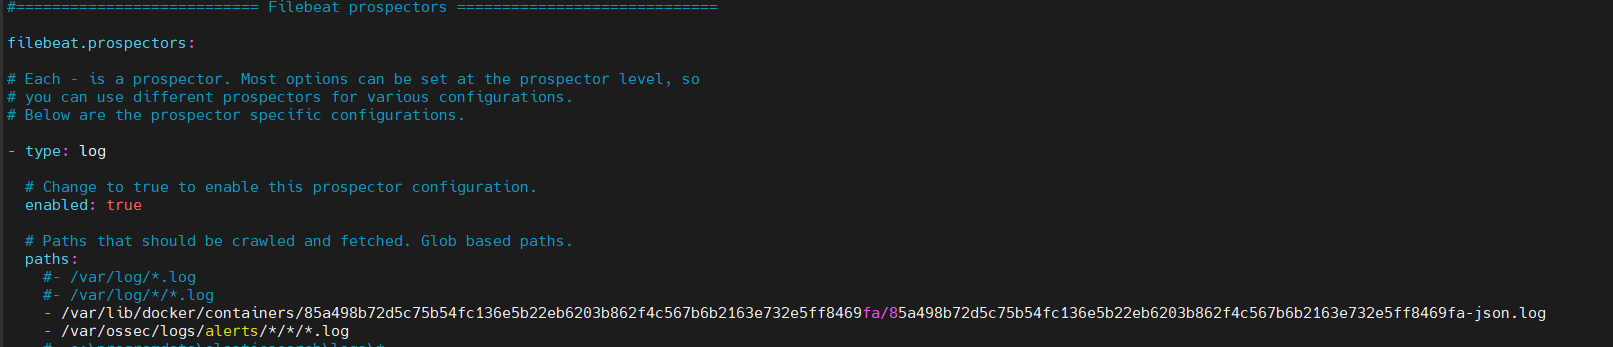
WAF:

Start filebeats on the webserver and WAF VMs :
1
2
systemctl enable filebeat
systemctl start filebeat
Install Logstash on the ELK-SOC VM :
1
sudo apt-get update && sudo apt-get install logstash
Configure LogStash on the ELK-SOC VM:
logstash.conf in the directory /etc/logstash/conf.d :
1
2
3
4
5
6
7
8
9
10
11
12
13
14
15
16
17
18
19
20
21
22
23
24
25
26
27
28
29
30
31
32
33
34
35
36
37
38
39
40
41
42
43
44
45
46
47
48
49
50
51
52
53
54
55
56
57
58
59
60
61
62
63
64
65
66
67
68
69
70
71
72
73
74
75
76
77
78
79
80
81
82
83
84
85
86
87
88
89
input {
beats {
port => 5044
}
}
filter {
# Docker logs
if [source] =~ "docker" {
json {
source => "message"
}
grok {
match => {
"log" => "%{TIMESTAMP_ISO8601:timestamp} %{WORD:log_level} %{GREEDYDATA:message}"
}
}
date {
match => ["timestamp", "ISO8601"]
target => "@timestamp"
}
}
# Apache access logs
if [source] =~ "access.log" {
grok {
match => {
"message" => "%{IPORHOST:client_ip} %{USER:ident} %{USER:auth} \[%{HTTPDATE:timestamp}\] \"%{WORD:verb} %{DATA:request} HTTP/%{NUMBER:http_version}\" %{NUMBER:response} (?:%{NUMBER:bytes}|-) \"%{DATA:referrer}\" \"%{DATA:agent}\""
}
}
date {
match => [ "timestamp", "dd/MMM/yyyy:HH:mm:ss Z" ]
target => "@timestamp"
}
}
# Apache error logs
if [source] =~ "error.log" {
grok {
match => {
"message" => "%{HTTPD_ERRORLOG} \[client %{IP:client_ip}:%{NUMBER:client_port}\](?: \[client %{IP:client_ip}\])? %{GREEDYDATA:error_message}"
}
}
grok {
match => { "message" => "\[hostname \"%{IP:destination_ip}\"\]" }
}
mutate {
rename => { "client_ip" => "[log][source][address]" }
rename => { "client_port" => "[log][source][port]" }
}
date {
match => [ "timestamp", "YYYY-MM-dd HH:mm:ss,SSS" ]
target => "@timestamp"
}
}
# ModSecurity audit logs
if [source] =~ "modsec_audit.log" {
grok {
match => {
"message" => [
"\[.*\] \[\d+\] %{DATA:modsec_timestamp} \[%{WORD:modsec_severity}\] %{GREEDYDATA:modsec_message}",
"%{GREEDYDATA:modsec_message}"
]
}
}
grok {
match => { "message" => "\[hostname \"%{IP:destination_ip}\"\]" }
}
date {
match => [ "modsec_timestamp", "dd/MMM/yyyy:HH:mm:ss Z" ]
target => "@timestamp"
}
}
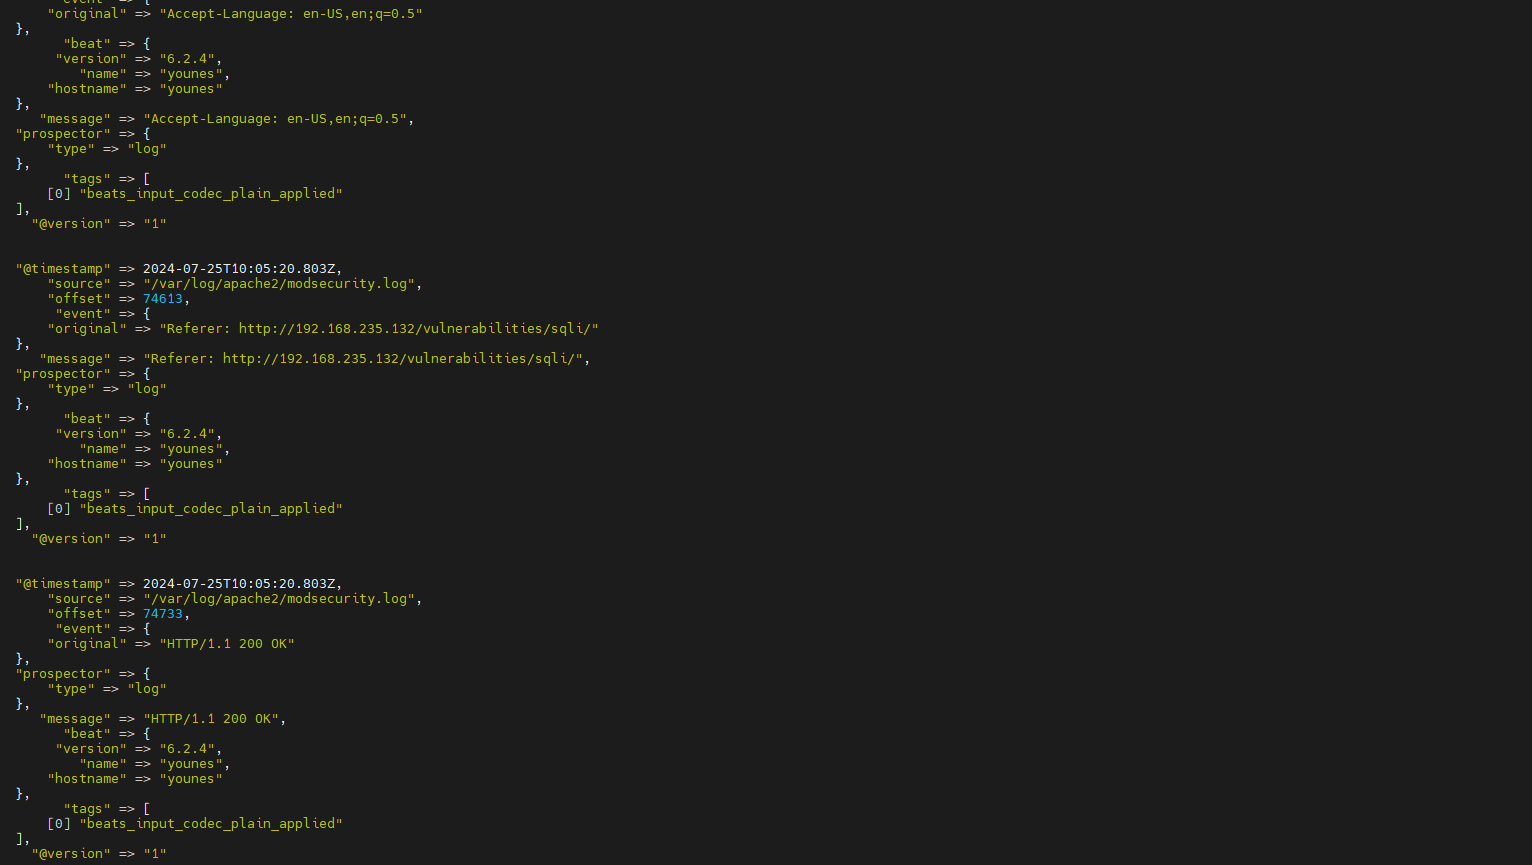
output {
elasticsearch {
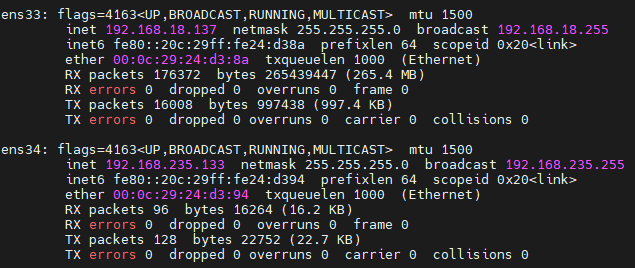
hosts => ["https://192.168.235.133:9200"]
user => "elastic"
password => "aIG_CK06ovuLj0vCc1mh"
ssl_enabled => true
ssl_certificate_authorities => ["/etc/elasticsearch/certs/http_ca.crt"]
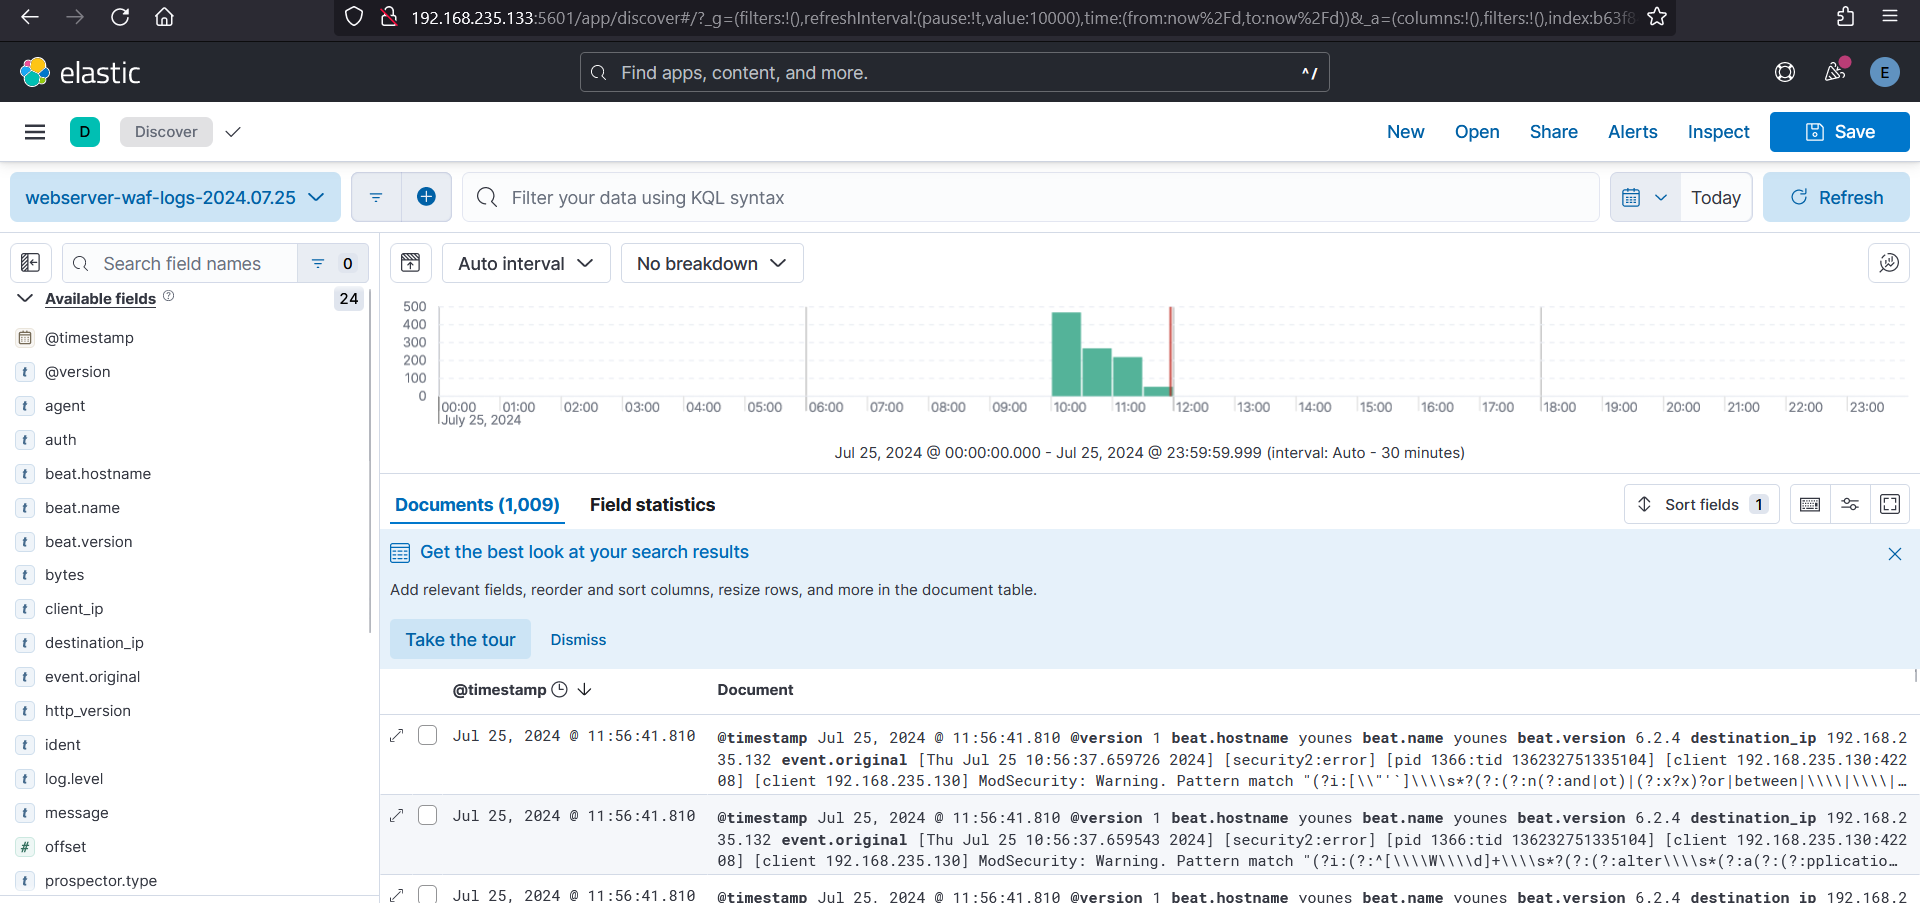
index => "webserver-waf-logs-%{+YYYY.MM.dd}"
}
stdout {
codec => rubydebug
}
}
1. Input Section
1
2
3
4
5
6
7
plaintextCopier le code
input {
  beats {
    port => 5044
  }
}
- Purpose: This section specifies the input plugins for Logstash.
beatsInput Plugin: This plugin listens on port 5044 for incoming data from Beats clients (such as Filebeat). Beats is a family of lightweight data shippers that send data to Logstash. Here, it’s configured to accept data on port 5044.
2. Filter Section
The filter section is used to parse and transform the incoming log data. Each log source is handled differently based on its characteristics.
Docker Logs
1
2
3
4
5
6
7
8
9
10
11
12
13
14
15
16
17
18
plaintextCopier le code
filter {
  if [source] =~ "docker" {
    json {
      source => "message"
    }
    grok {
      match => {
        "log" => "%{TIMESTAMP_ISO8601:timestamp} %{WORD:log_level} %{GREEDYDATA:message}"
      }
    }
    date {
      match => ["timestamp", "ISO8601"]
      target => "@timestamp"
    }
  }
}
if [source] =~ "docker": Applies this filter block if the log source contains the string"docker".json: Parses the JSON-formatted log data from themessagefield.grok: Extracts fields from thelogfield using a pattern. The pattern captures:timestamp: The timestamp of the log.log_level: The level of logging (e.g., INFO, ERROR).message: The actual log message.
date: Parses the timestamp to set the@timestampfield in ISO8601 format.
Apache Access Logs
1
2
3
4
5
6
7
8
9
10
11
12
13
14
15
plaintextCopier le code
filter {
  if [source] =~ "access.log" {
    grok {
      match => {
        "message" => "%{IPORHOST:client_ip} %{USER:ident} %{USER:auth} \[%{HTTPDATE:timestamp}\] \"%{WORD:verb} %{DATA:request} HTTP/%{NUMBER:http_version}\" %{NUMBER:response} (?:%{NUMBER:bytes}|-) \"%{DATA:referrer}\" \"%{DATA:agent}\""
      }
    }
    date {
      match => [ "timestamp", "dd/MMM/yyyy:HH:mm:ss Z" ]
      target => "@timestamp"
    }
  }
}
if [source] =~ "access.log": Applies this filter block to logs with the source containing"access.log".grok: Parses Apache access log lines using a pattern that extracts fields such as:client_ip: IP address of the client.ident: Identity of the client (often ``).auth: Authentication username (often ``).timestamp: Timestamp of the request.verb: HTTP method (e.g., GET, POST).request: Requested resource.http_version: HTTP version.response: HTTP response code.referrer: Referrer URL.agent: User agent string.
date: Parses the timestamp with the given format to set the@timestampfield.
Apache Error Logs
1
2
3
4
5
6
7
8
9
10
11
12
13
14
15
16
17
18
19
20
21
22
plaintextCopier le code
filter {
  if [source] =~ "error.log" {
    grok {
      match => {
        "message" => "%{HTTPD_ERRORLOG} \[client %{IP:client_ip}:%{NUMBER:client_port}\](?: \[client %{IP:client_ip}\])? %{GREEDYDATA:error_message}"
      }
    }
    grok {
      match => { "message" => "\[hostname \"%{IP:destination_ip}\"\]" }
    }
    mutate {
      rename => { "client_ip" => "[log][source][address]" }
      rename => { "client_port" => "[log][source][port]" }
    }
    date {
      match => [ "timestamp", "YYYY-MM-dd HH:mm:ss,SSS" ]
      target => "@timestamp"
    }
  }
}
if [source] =~ "error.log": Applies this filter block to logs with the source containing"error.log".grok: Uses two patterns to extract fields:- The first pattern captures fields like:
client_ip: IP address of the client.client_port: Port of the client.error_message: Detailed error message.
- The second pattern captures the
destination_ipfrom the hostname.
- The first pattern captures fields like:
mutate: Renames fields:client_ipis renamed to[log][source][address].client_portis renamed to[log][source][port].
date: Parses the timestamp to set the@timestampfield.
ModSecurity Audit Logs
1
2
3
4
5
6
7
8
9
10
11
12
13
14
15
16
17
18
19
20
21
plaintextCopier le code
filter {
  if [source] =~ "modsec_audit.log" {
    grok {
      match => {
        "message" => [
          "\[.*\] \[\d+\] %{DATA:modsec_timestamp} \[%{WORD:modsec_severity}\] %{GREEDYDATA:modsec_message}",
          "%{GREEDYDATA:modsec_message}"
        ]
      }
    }
    grok {
      match => { "message" => "\[hostname \"%{IP:destination_ip}\"\]" }
    }
    date {
      match => [ "modsec_timestamp", "dd/MMM/yyyy:HH:mm:ss Z" ]
      target => "@timestamp"
    }
  }
}
if [source] =~ "modsec_audit.log": Applies this filter block to logs with the source containing"modsec_audit.log".grok: Uses patterns to extract fields:- The first pattern captures:
modsec_timestamp: Timestamp of the ModSecurity audit log.modsec_severity: Severity level of the message.modsec_message: The detailed audit message.
- The second pattern captures
destination_ipfrom the hostname.
- The first pattern captures:
date: Parses themodsec_timestampto set the@timestampfield.
3. Output Section
1
2
3
4
5
6
7
8
9
10
11
12
13
14
15
plaintextCopier le code
output {
  elasticsearch {
    hosts => ["https://192.168.235.133:9200"]
    user => "elastic"
    password => "aIG_CK06ovuLj0vCc1mh"
    ssl_enabled => true
    ssl_certificate_authorities => ["/etc/elasticsearch/certs/http_ca.crt"]
    index => "webserver-waf-logs-%{+YYYY.MM.dd}"
  }
  stdout {
    codec => rubydebug
  }
}
elasticsearch: Sends the processed log data to an Elasticsearch cluster.hosts: Specifies the Elasticsearch endpoint.user: Authentication username for Elasticsearch.password: Authentication password for Elasticsearch.ssl_enabled: Indicates that SSL/TLS should be used for secure communication.ssl_certificate_authorities: Specifies the path to the CA certificate for validating the server’s certificate.index: Defines the index name pattern in Elasticsearch, with a daily timestamp for index rotation (e.g.,webserver-waf-logs-2024.08.06).stdout: Outputs the processed log data to the terminal for debugging purposes.codec => rubydebug: This codec formats the output in a human-readable way, showing the full details of each event in a structured format. This is useful for debugging and verifying that the data is being processed correctly before sending it to Elasticsearch.
Summary
This Logstash configuration file sets up a pipeline to process and transform log data from multiple sources. Here’s a summary of its functionality:
- Input:
- Beats Input: Listens for incoming log data from Beats (like Filebeat) on port 5044.
- Filters:
- Docker Logs: Parses JSON logs from Docker, extracts fields like timestamp, log level, and message.
- Apache Access Logs: Extracts fields from Apache access logs including client IP, request method, response code, and user agent.
- Apache Error Logs: Extracts error details from Apache error logs, including client IP and port, and renames fields for consistency.
- ModSecurity Audit Logs: Parses ModSecurity audit logs to extract timestamp, severity, and message, and processes additional details.
- OSSEC HIDS Logs: Parses OSSEC alert logs to extract alert IDs, types, and details, and adds a
sourcefield to indicate the origin of the logs.
- Output:
- Elasticsearch: Sends the processed log data to an Elasticsearch cluster with specified credentials and SSL/TLS configuration. Data is indexed daily based on the date.
- STDOUT: Outputs the data to the terminal for debugging and verification purposes.
This configuration ensures that log data from different sources is correctly parsed, transformed, and sent to Elasticsearch for indexing and analysis, while also allowing for real-time debugging of the log processing pipeline.
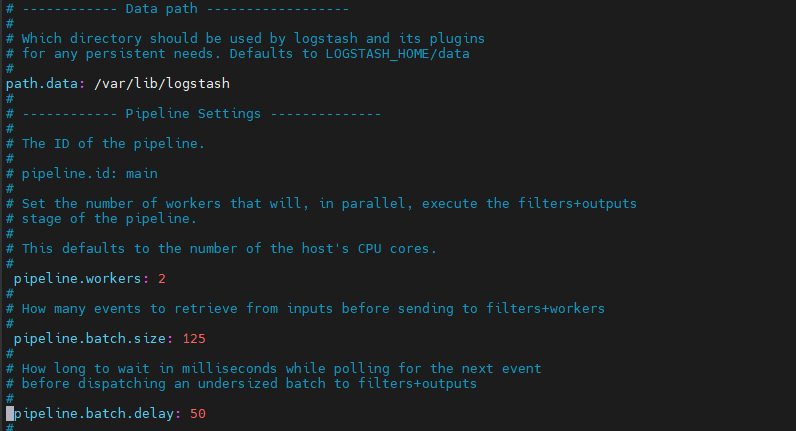
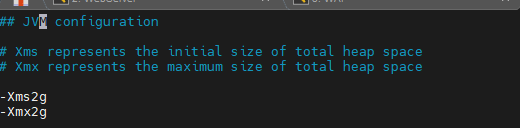
For performance reasons :
/etc/logstash/logstash.yml
/etc/logstash/jvm.options
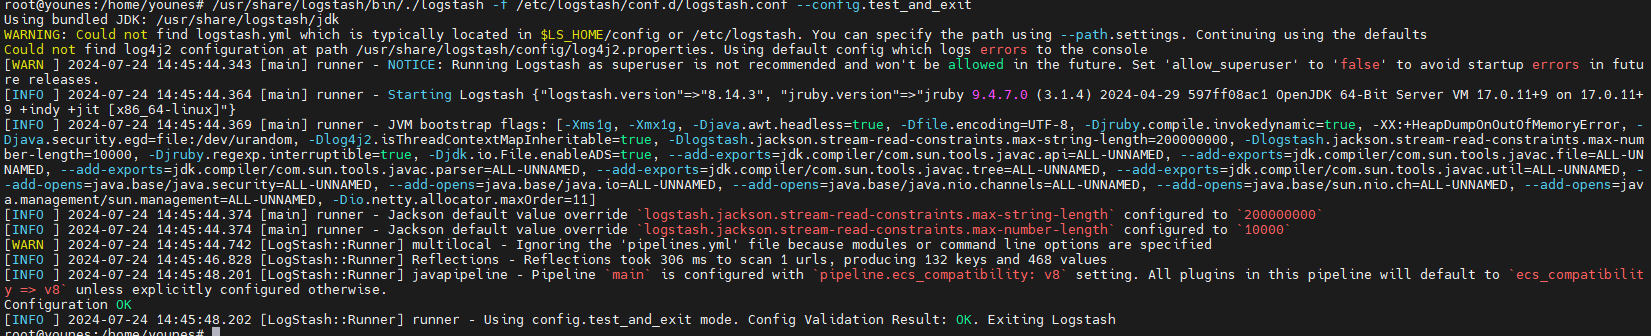
Test our logstash configuration on the ELK-SOC VM:
navigate to the Logstash Bin directory
1
cd /usr/share/logstash/bin
Run the command
1
/usr/share/logstash/bin/./logstash -f /etc/logstash/conf.d/logstash.conf --config.test_and_exit
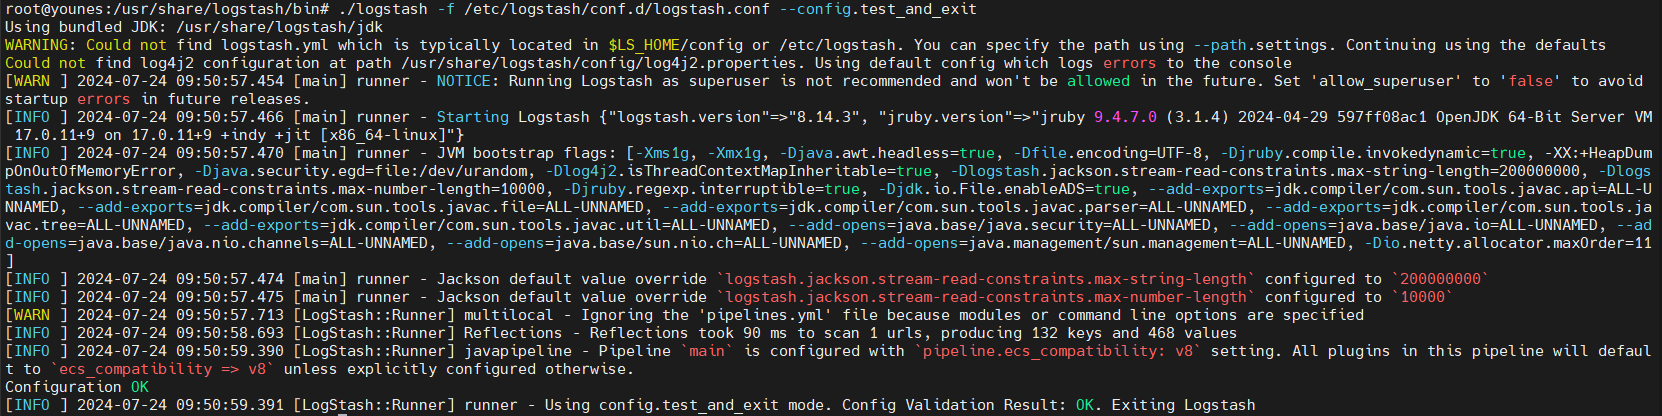
The configuration test is valid ,there are some warnings worth looking into but they can be ignored for the moment
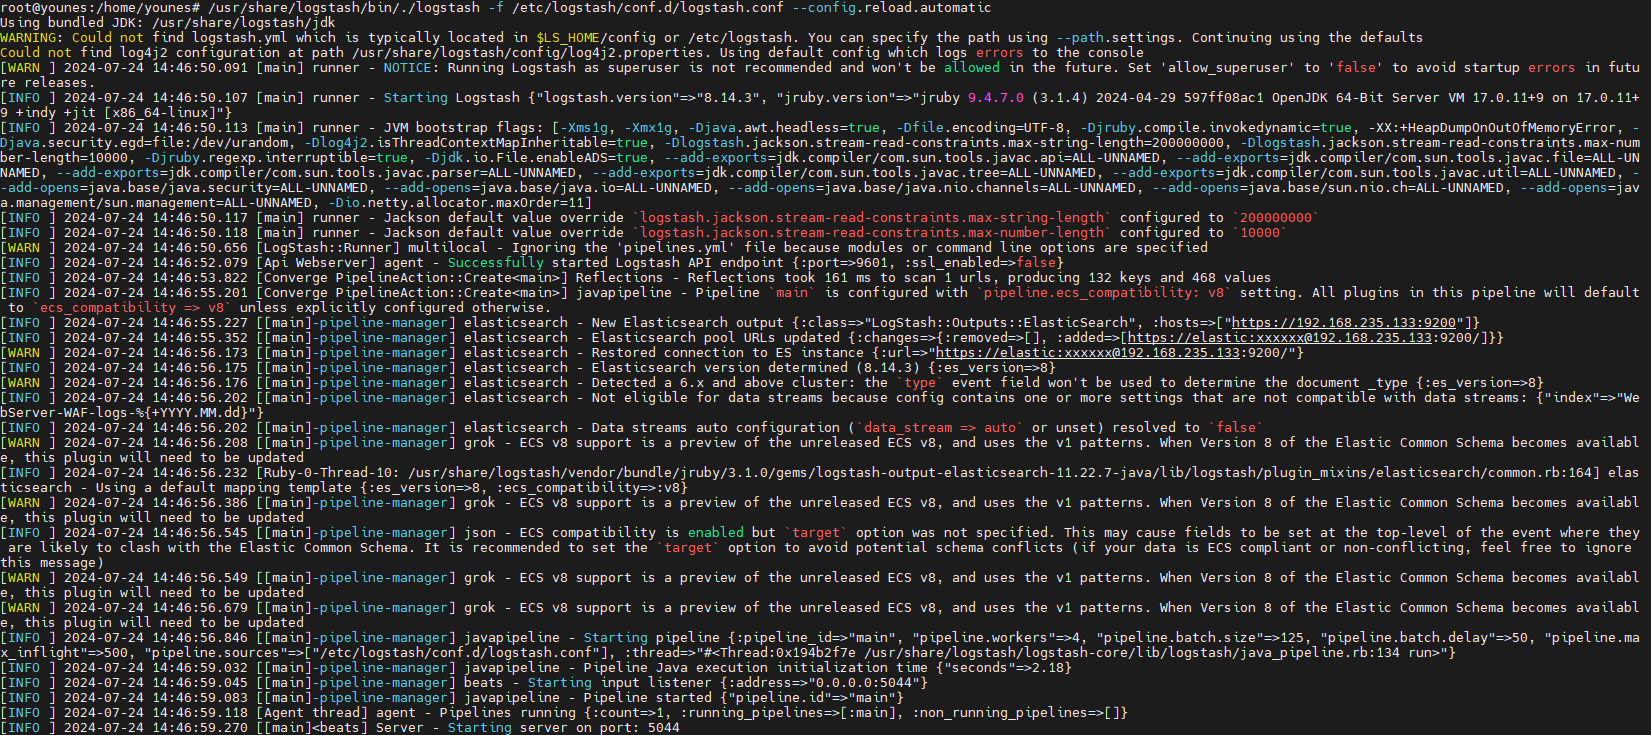
Start Logstash with automatic reload wo the Logstash reloads automatically the configuration file whenever a change is made
1
/usr/share/logstash/bin/./logstash -f /etc/logstash/conf.d/logstash.conf --config.reload.automatic